Looking for a Python mini-project that’s simple, practical, and incredibly useful? In this guide, we’ll walk you through building a Personal Expense Tracker using Python. Whether you’re an engineering student or just someone trying to control your monthly budget, this project is a must-try.
💡 Why Build an Expense Tracker?
I know that there are tons of tracking apps at your tip of your fingers, but building someting private and keeping track of everything under your own code will be a good relief of mind and plus this will be an excellent project if you are trying to bring the mix of python on to your projects.
Plus, keeping track of your expenses is the first step toward better financial habits. This project lets you:
- Log daily expenses manually or via a GUI
- Categorize transactions (food, travel, bills, etc.)
- View monthly totals and generate simple reports
- Learn about file handling, data storage, and basic GUI building with Python
🛠️ Tools & Technologies
So lets get started with building the project, the project aims to keep the setup simple so that you can easily follow up and later down the road add in modules to expand it to a full fledged project that you can deploy from your own domain and help others live better!!
So for the recipe, we are using
- Python 3.8+
- Tkinter (for GUI)
- Pandas (for data manipulation)
- CSV (for lightweight storage)
📁 Step 1: Setup and Data Storage
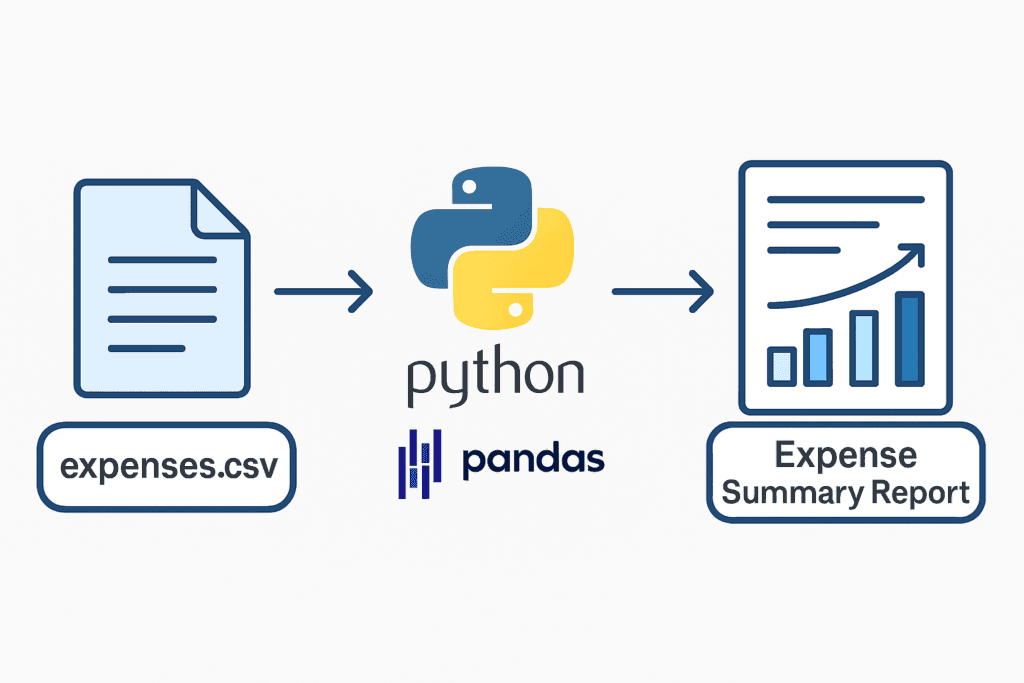
We’ll store all expense entries in a CSV file. This ensures simplicity while allowing easy upgrades later (e.g., moving to SQLite or Firebase).
import csv
from datetime import datetime

filename = 'expenses.csv'

# Ensure file has headers
with open(filename, 'a', newline='') as f:
    writer = csv.writer(f)
    writer.writerow(['Date', 'Category', 'Amount', 'Description'])
This sets up your base file with headers. Every transaction will be appended here.
🧾 Step 2: Add Expense Entry via Command Line
What Does This Step Do?
This step allows the user to manually input an expense directly from the command line. It’s like writing down your spending in a digital notebook. When you run the function:
- You’re asked to enter the category (like food, travel, bills, etc.)
- Then the amount you spent
- And an optional description of what it was for
- The program automatically adds today’s date
- Finally, all this information is saved to your
expenses.csvfile as a new row
It’s a quick and simple way to begin recording your expenses without any fancy interfaces — great for learning how to handle user input and file writing in Python. Here’s a simple way to input expenses.
def add_expense():
    category = input("Enter category (Food/Travel/Bills/Other): ")
    amount = input("Enter amount: ")
    desc = input("Enter description (optional): ")
    date = datetime.now().strftime('%Y-%m-%d')

    with open('expenses.csv', 'a', newline='') as f:
        writer = csv.writer(f)
        writer.writerow([date, category, amount, desc])
        print("✅ Expense Added!")
You can run this function in a loop or wrap it in a basic menu.
📊 Step 3: Generate Monthly Report
What Does This Step Do?
This step helps you analyze your spending habits by reading your saved expenses and summarizing them by category. Instead of going through each entry manually, we use Pandas to automatically calculate totals.

Why Use Pandas?
Pandas is a powerful Python library for working with structured data. It makes it easy to:
- Read CSV files with a single line of code
- Convert amounts from strings to numbers safely
- Group data by categories and sum totals
- Format reports that are clean and easy to understand
So essentially, this step transforms your raw data into insights. It tells you how much you’ve spent in each category like Food, Travel, or Bills. That’s the first step toward budgeting smarter!
Here’s how it’s implemented: Use Pandas to read the file and generate a simple summary of your expenses.
import pandas as pd

def view_report():
    df = pd.read_csv('expenses.csv')
    df['Amount'] = pd.to_numeric(df['Amount'], errors='coerce')
    print("\nTotal spent by category:")
    print(df.groupby('Category')['Amount'].sum())
🖥️ Step 4: Build a Simple GUI (Optional but Impressive!)
As in the previous project, we are in love with Tkinter.
What Does This Step Do?
This step creates a user-friendly interface for logging expenses. Instead of typing commands in the terminal, users get a small window where they can enter their data using text fields and a button. It looks more like a simple app, making it easier and more accessible—especially for non-technical users.
Why Use Tkinter?
- Tkinter is Python’s built-in GUI library, so you don’t need to install anything extra
- It’s perfect for small projects that don’t require web-based dashboards
- It helps students learn event-driven programming and UI layout basics
- It integrates easily with file handling and logic from your backend code
Why Not Use a Database?
While databases like SQLite or PostgreSQL offer more robust data management, they come with additional setup and complexity. For this beginner-friendly project:
- A CSV file is lightweight, portable, and human-readable
- It requires no external setup or configuration
- It keeps the code simple and focused on learning Python fundamentals
Once you’re comfortable with this version, upgrading to a database is a great next step!
A GUI makes your tracker feel more professional. Let’s use Tkinter:
import tkinter as tk
from tkinter import messagebox

def submit_expense():
    category = cat_entry.get()
    amount = amt_entry.get()
    desc = desc_entry.get()
    date = datetime.now().strftime('%Y-%m-%d')

    with open('expenses.csv', 'a', newline='') as f:
        writer = csv.writer(f)
        writer.writerow([date, category, amount, desc])
        messagebox.showinfo("Success", "Expense Added")

root = tk.Tk()
root.title("Expense Tracker")

# Labels and fields
tk.Label(root, text="Category").grid(row=0)
tk.Label(root, text="Amount").grid(row=1)
tk.Label(root, text="Description").grid(row=2)

cat_entry = tk.Entry(root)
amt_entry = tk.Entry(root)
desc_entry = tk.Entry(root)

cat_entry.grid(row=0, column=1)
amt_entry.grid(row=1, column=1)
desc_entry.grid(row=2, column=1)

# Submit button
tk.Button(root, text="Add Expense", command=submit_expense).grid(row=3, column=0, columnspan=2)

root.mainloop()
⚙️ Possible Add-Ons
- Add pie charts using
matplotlib - Export monthly reports
- Add a login screen for multi-user access
- Migrate to SQLite for structured data
🧪 How to Use This Project
- Run the Python script to launch CLI or GUI
- Add your expenses as they happen
- Run the report function to see a breakdown
📋 Viva Questions You Might Face
- Why use CSV over a database?
- What modules does Tkinter use internally?
- What are the pros/cons of GUI vs CLI?
- How would you optimize this for large datasets?
- Can you auto-categorize using AI?
✅ Final Thoughts
This project is great for practicing real-world Python usage, learning file handling, and building basic user interfaces. You’ll walk away with a tool you can actually use!
Want the full code + optional upgrades? 👉


